

The short answer
Customer journey mapping is the practice of visualizing every interaction a customer has with your brand from first awareness through advocacy or churn. A good map captures actions, thoughts, emotions, touchpoints, and pain points at each stage. A great map becomes the source of truth that drives operational decisions across product, marketing, support, and ops.
This guide is the practitioner version of "how to map a customer journey." I've built journey maps for Mejuri, Canada Goose, and a half-dozen mid-market brands through rethinkCX. The seven-step methodology below is what actually works. The big lesson, restated upfront because it matters more than any individual step: most journey maps fail not because the methodology is wrong but because the output never gets operationalized. Build for action from the start.
What a customer journey map actually is (and isn't)
A customer journey map is:
- A visual representation of the customer's experience across stages and touchpoints
- A diagnostic tool for finding friction
- A coordination artifact for cross-functional teams to align on priorities
- A living document that updates as customer behavior and your business evolve
A customer journey map is not:
- A one-time workshop output that gets printed and forgotten
- A complete model of every possible customer (it's specific to one persona, one journey)
- A replacement for direct customer research (it organizes research; it doesn't substitute for it)
- A pretty graphic with no operational consequences
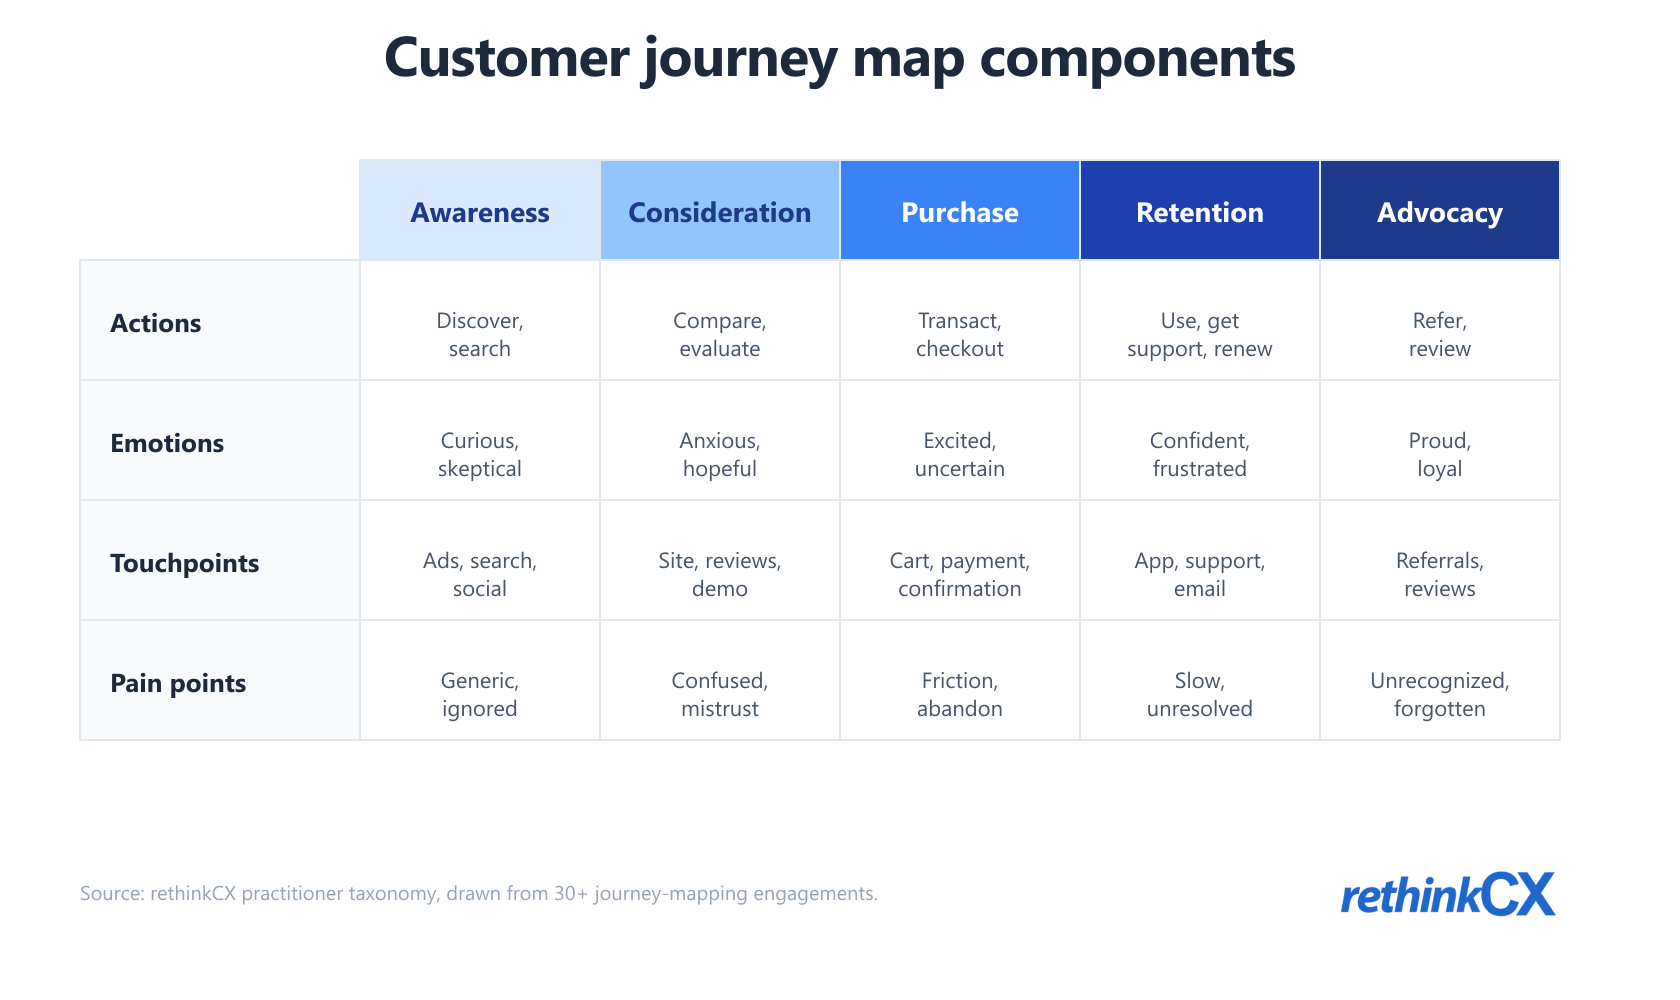
Most journeys map cleanly to five high-level stages. The substages vary by industry; the skeleton holds.
| Stage | What happens | What to map |
|---|---|---|
| Awareness | Customer becomes aware of you | Discovery touchpoints, first-impression signals |
| Consideration | Customer evaluates whether to buy | Comparison behavior, information needs, objection patterns |
| Purchase | Customer transacts | Checkout flow, payment, immediate post-purchase confirmation |
| Retention | Customer uses, gets supported, renews | Onboarding, support interactions, recurring usage, renewal triggers |
| Advocacy | Customer recommends you | Referral behavior, review activity, advocacy moments |
The distinction matters because it shapes how much effort to put into the map's design vs into the operational follow-through. The brands that get the most value invest 30% of effort in the map and 70% in operationalizing it. The brands that get the least value invert that ratio.
One scoping decision worth naming explicitly before any mapping starts: the customer journey is not the same as the buyer journey. The buyer journey ends at the contract; the customer journey begins there. Teams that conflate them end up with maps that over-weight pre-sale stages and under-weight onboarding and renewal. We unpack that distinction in buyer journey vs customer journey; read it first if your map currently spans both.
The seven steps
Step 1: Define the scope
The first decision is what to map. The temptation is to map everything. That always produces a map nobody uses.
Pick one of each:
- One persona. "New B2C customer, age 25-35, mobile-first." Not "all our customers."
- One journey. "First purchase from initial discovery to post-purchase support." Not "everything they ever do."
- One outcome. "Reduce cart abandonment" or "improve onboarding completion rate." Not "improve CX overall."
The narrower the scope, the more useful the map. You can always map more journeys later. The brands that succeed at journey mapping have a portfolio of 5-15 maps over time, each focused, rather than one ambitious map that covers everything.
Step 2: Build a data-driven persona
Personas are the foundation of useful mapping. A weak persona produces a weak map.
A real persona has four layers:
- Demographic: age, location, role, lifecycle stage, behavioral segment
- Behavioral: what they actually do (from analytics, transaction data, support history)
- Motivational: why they're engaging with your brand, what outcome they want, what they're substituting for
- Emotional: the feelings around the engagement (anxiety, excitement, frustration, loyalty)
Build personas from data, not from team intuition. The two reliable inputs:
- Quantitative data (analytics, behavioral logs, transaction records)
- Qualitative interviews (15-30 customers matching the rough segment)
Validate the persona against real customers before mapping the journey. If your team can't name three actual customers who fit the persona, the persona is fictional and the map will be too.
For deeper coverage of how to build the qualitative side see our voice of the customer programs guide.
Step 3: Identify touchpoints across channels
A touchpoint is anywhere the customer encounters your brand: website, app, email, ad, social media, customer service, in-store, packaging, post-purchase communication. The touchpoint inventory has to be exhaustive for the journey you're mapping.
For each touchpoint, capture:
- Channel (web, app, email, voice, etc.)
- Owner inside your company (which team is responsible)
- Customer's intent at that moment (what they're trying to accomplish)
- Quality signal (CSAT, NPS, conversion rate, error rate at this touchpoint)
The touchpoint inventory often surfaces ownership gaps: touchpoints nobody owns, or touchpoints owned by teams who don't realize they own them. Surfacing these gaps is itself a meaningful CX improvement, before any mapping work.
For the omnichannel framing of how touchpoints connect see our omnichannel customer service guide.
Step 4: Map the emotional journey
Customer behavior is driven by emotion as much as logic. A map that captures actions but ignores feelings misses the friction that actually drives churn.
For each touchpoint, capture:
- Customer's emotional state arriving at the touchpoint (anxious, hopeful, frustrated, indifferent)
- Emotional change through the touchpoint (improved, worsened, unchanged)
- Emotional state leaving the touchpoint (confident, disappointed, confused, satisfied)
Plot the emotional arc as a sentiment line across the journey. The peaks and valleys reveal where the experience either delights or disappoints. The valleys are where retention leaks happen.
Sources for emotional data:
- Customer interviews (highest fidelity, lowest scale)
- Open-ended survey responses (good fidelity, mid scale)
- Sentiment analysis on support tickets and social mentions (mid fidelity, high scale)
- Session recordings showing rage clicks, pause-and-leave patterns (mid fidelity, scales with cost)
Step 5: Identify friction and pain points
With actions, touchpoints, and emotions mapped, the friction points become visible. Friction is where the customer hits resistance — bad UX, slow response, missing information, broken handoff between teams.
The friction points worth fixing share two properties:
- They show up in quantitative data (drop-off, support ticket volume, error rate, time-on-task)
- They show up in qualitative data (customer interviews mention them, support tickets describe them)
Single-source friction (only quant or only qual) is usually noise or measurement artifact. Friction visible in both is real and worth investing in.
Slow service is the most expensive friction class to ignore. HubSpot's 2024 State of Service report found 82% of service teams now report customers expecting resolution immediately, with a desired timeline of less than three hours. Any touchpoint where the map shows multi-day response times is operating against a market that expects sub-three-hour resolution, which means the friction at that touchpoint is compounding faster than at slower-moving touchpoints elsewhere on the journey.
Prioritize the friction list by:
- Revenue impact (how much retention or conversion is at stake)
- Effort to fix (cheap wins ship first)
- Cross-functional dependency (single-team fixes ship faster than multi-team ones)
For the operational side of how to address support-related friction see our how to reduce customer service response time guide.
Step 6: Develop actionable solutions
A journey map without solutions is incomplete. For each top-priority friction point:
- Define the desired state. What should the customer experience instead?
- Identify the operational change required. What team has to do what differently?
- Estimate cost and timeline. Be honest. Most CX improvements are 2-4x more expensive than they look in a workshop.
- Define the success metric. How will you know the change worked?
Workshop the solutions cross-functionally. The teams who own the touchpoints have to be in the room when solutions get designed. Otherwise the solutions don't survive contact with operational reality.
Step 7: Operationalize and iterate
This is the step that determines whether the map produces value or sits unused.
Operationalizing means:
- The map gets updated quarterly (or whenever a significant change happens)
- The friction prioritization gets reviewed monthly
- Ownership for each solution is named and tracked
- Impact gets measured against the success metrics defined in Step 6
- Lessons feed back into the map (which solutions worked, which didn't, why)
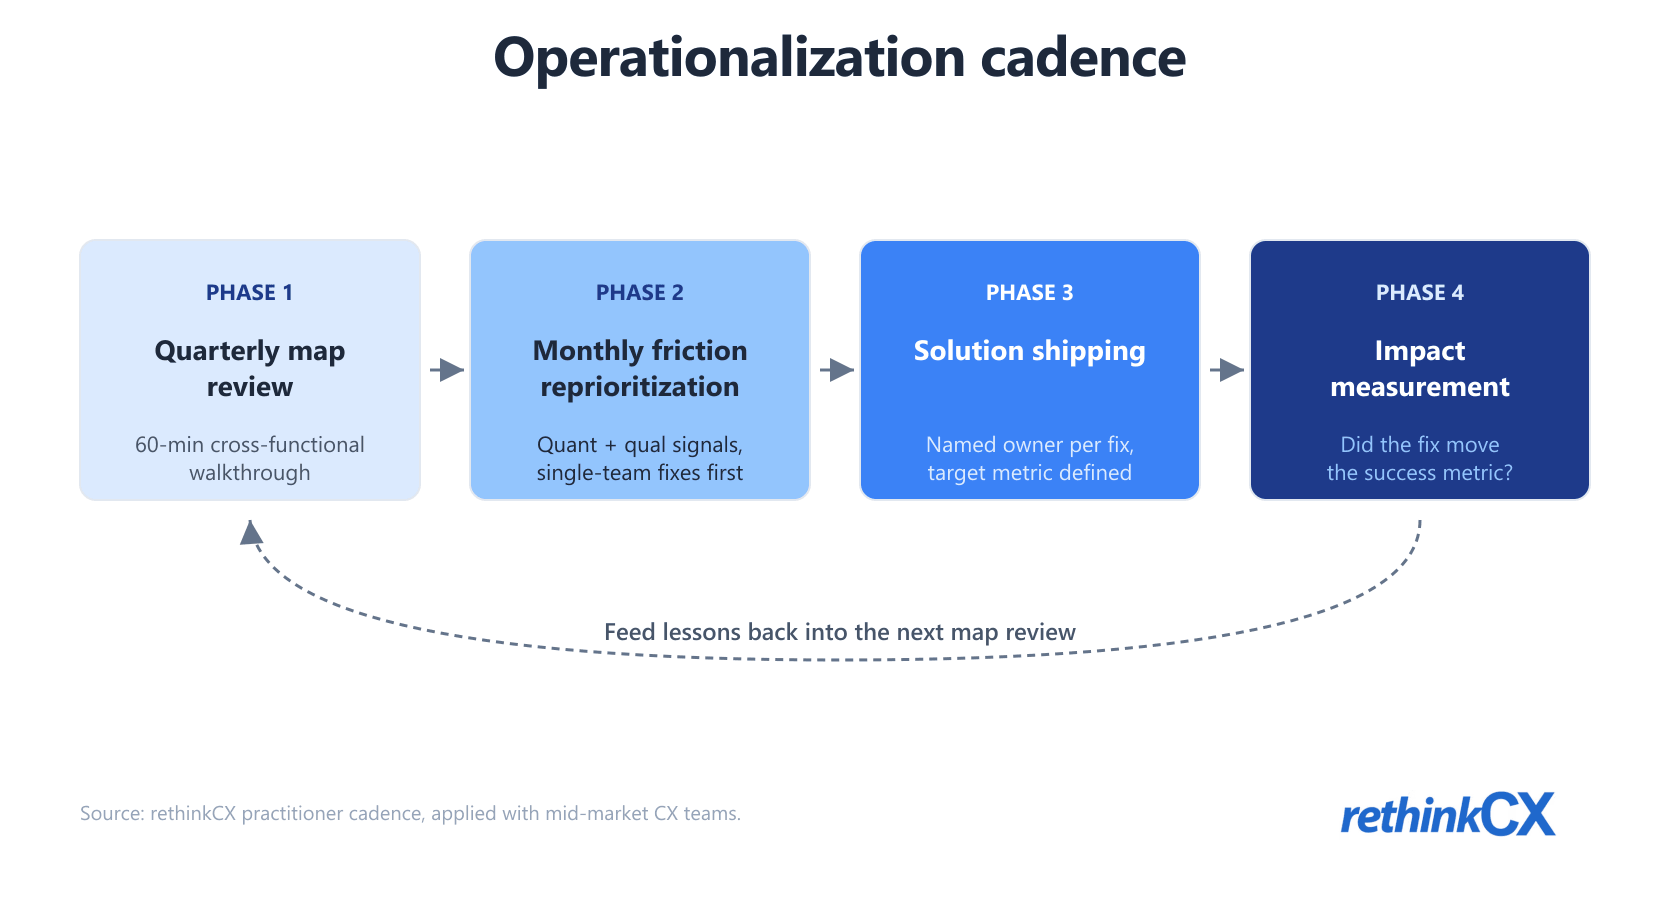
The brands that get the most value run a lightweight quarterly journey review: 60-minute meeting, cross-functional, walks through the current map, updates friction priorities, assigns next-quarter focus. The brands that get the least value treat the map as a one-time artifact. Forrester's January 2026 analysis of customer journey management arrives at the same conclusion from the analyst side: leading organizations now treat journey maps as operating systems that connect discovery, delivery, and measurement, not as static visualization deliverables.
Wiring the cadence to actual operational tooling is where most teams stall. The friction priorities from the map have to land somewhere a team owns, gets reminded about, and reports against. The operational case layer that converts journey-map findings into tracked actions is one pattern that works: each prioritized friction point becomes a case object with an owner, a target metric, and a closure trigger, so the quarterly review has something concrete to walk through rather than a stale slide.
Customer journey touchpoints: how to inventory and prioritize them
Step 3 above is where most journey maps quietly fail, because the touchpoint inventory is the part that looks easy and isn't. The customer journey touchpoints that matter aren't always the ones the team thinks about — and the touchpoints the team thinks they own aren't always the ones the customer actually encounters.
A useful working definition: a customer journey touchpoint is any moment of contact between the customer and your brand, regardless of channel, ownership, or intentionality. This includes the touchpoints you control (website, app, support email, store associate), the touchpoints you sort-of control (third-party reviews, partner integrations, delivery driver), and the touchpoints you don't control at all (a friend's recommendation, a competitor's ad seen during your customer's browsing session). The first category is where most journey maps end. Including the second and third is where the map starts producing insight other teams haven't already seen.
The inventory pattern that works for me: walk through 5-10 actual recent customer journeys end to end, captured from session replay or support transcripts, and list every touchpoint that customer crossed. Then repeat for a different persona. Then a different journey type. The list that emerges is usually 30-50% larger than what the cross-functional workshop produced from memory, and the additions are disproportionately high-friction.
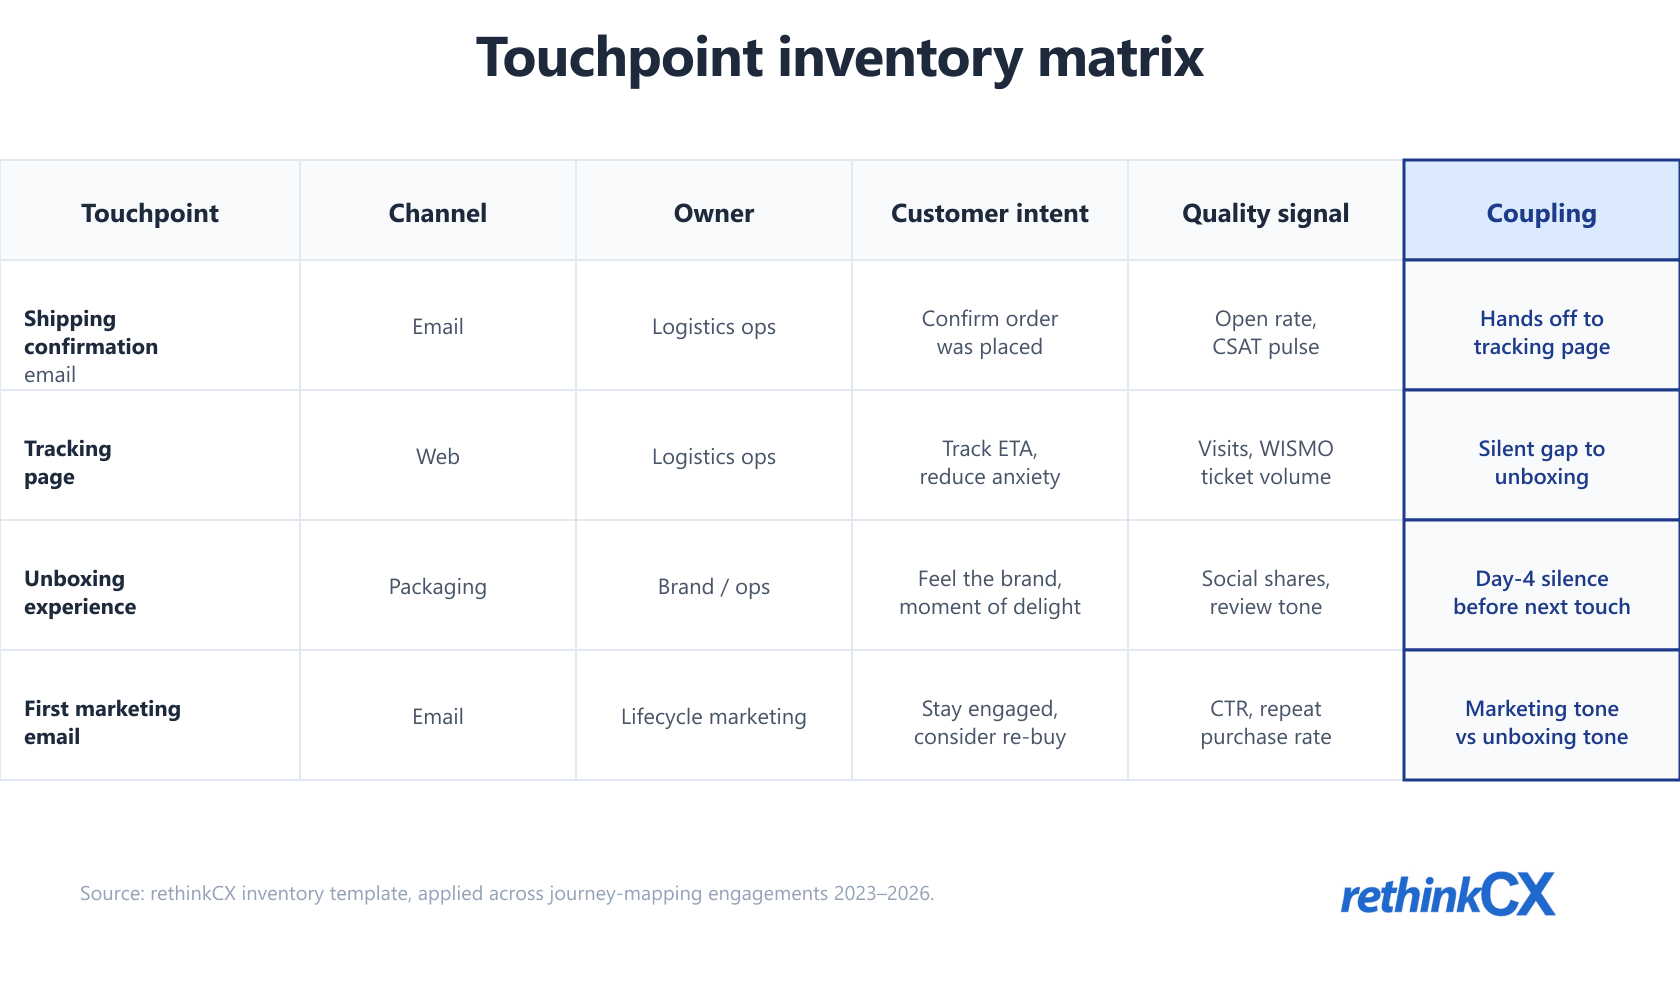
For each touchpoint worth keeping on the map, capture five fields:
- Channel (web, app, email, voice, store, packaging, social, third-party).
- Owner (which internal team is accountable for this moment going well).
- Customer intent (what they're trying to accomplish, in their words from interviews — not your team's interpretation).
- Quality signal (the metric that tells you the touchpoint is working: CSAT, conversion, error rate, time-on-task, NPS at this stage).
- Coupling (which adjacent touchpoint this one hands off to or receives from).
The coupling field is the one most templates skip and the one that surfaces the most actionable friction. Touchpoints in isolation can each work fine while the seams between them break the journey. At Mejuri the post-purchase confirmation email worked, the shipping tracker worked, and the unboxing experience worked — but the gap between the shipping confirmation and the first marketing-list email created an awkward silence on day 4 that customers consistently called out in NPS comments. None of the individual touchpoints was the problem; the coupling was.
Prioritization, once the inventory is built: rank touchpoints by traffic volume (how many customers cross this) × friction severity (drop-off rate, NPS impact, complaint frequency at this point) × ease of fix (single team, multiple teams, requires platform change). The high-volume, high-friction, single-team touchpoints are where the first quarter of operational work belongs. The high-volume, high-friction, multi-team touchpoints are where the cross-functional governance has to be set up first; rushing operational fixes there usually fails. Low-volume touchpoints, regardless of friction, are deprioritized for now even if they look bad in the map.
The two failure modes I watch for in touchpoint inventory work: over-listing and under-listing. Over-listing produces a map with 80+ touchpoints, none of which has enough scrutiny to identify whether it's actually a problem; the team does too much shallow work. Under-listing — usually because the workshop was time-boxed and people defaulted to "the obvious touchpoints" — produces a map that looks complete but skips the seams. The fix for both is the same: walk actual customer journeys, not just brainstorm in a workshop.
Types of journey maps: current state, future state, day-in-the-life, service blueprint
Most journey-mapping conversations conflate four distinct artifacts that serve different jobs. Picking the right one for the question being asked saves a quarter of wasted workshop time.
Current-state map. The most common starting point and the default for any team that hasn't mapped before. Diagnoses what's actually happening across the journey today, finds friction, and produces the prioritization input for operational work. If the team is debating "where do we lose customers?", this is the map to build.
Future-state map. The journey as it should be after a planned redesign. Useful when the team has committed to a structural change (channel addition, onboarding rework, retention motion overhaul) and needs a target state to design against. Building a future-state map without a current-state map first is almost always a mistake; the redesign has nothing to anchor against.
Day-in-the-life map. Zooms out to the customer's broader context: what they do all day, where the product or service fits, what competes for their attention. Most useful for B2C consumer brands and for early-stage product discovery. Less useful for established service operations where the journey is well-understood and the question is operational improvement, not contextual understanding.
Service blueprint. Adds the backstage operational view on top of a journey map: what teams, tools, processes, and handoffs power each touchpoint. The right next layer once the current-state journey map has surfaced friction that crosses team boundaries. Service blueprints make ownership and handoff failures visible in a way customer-facing journey maps cannot.
The honest take: most teams start with the wrong artifact. Future-state maps get drawn when the team hasn't done current-state diagnosis. Service blueprints get built when the operational data isn't yet captured. Day-in-the-life maps get used for B2B contexts where they add noise. Sequence matters. Current state first, then prioritize friction, then service blueprint for the cross-team friction points, then future state as the redesign target. Skipping steps is the workshop tax that produces unused maps.
What I'd do differently if I were starting today
Patterns from doing this work across multiple brands:
Start with the journey that's failing financially. Not the one that looks best for a workshop. If repeat purchase is the problem, map the post-purchase journey. If onboarding completion is dropping, map onboarding. Strategy work compounds by solving real problems.
Map at a useful resolution. Too high-level (5 boxes, no detail) and the map is decorative. Too low-level (every micro-interaction) and nobody can use it. The right resolution is "high enough to fit on one page, detailed enough that ownership and friction are visible." Usually 15-30 touchpoints.
Validate with actual customers before shipping the map. Walk 3-5 customers through the map. If they say "yes, that's exactly what I do," you got it right. If they say "no, I do this other thing instead," your map is wrong and the work was wasted. The fuller method, including what to do when customers and your data disagree, is in how to validate a customer journey map.
Build for the team, not for the executive presentation. The map's primary audience is the cross-functional team who'll execute against it. If executives also see it, that's fine, but design for utility not aesthetics.
Don't map B2B and B2C journeys with the same template. They have fundamentally different stage structures. B2B has procurement, multi-stakeholder decisions, longer cycles. B2C has impulse, emotion-driven buying, shorter cycles. Trying to use one template for both produces weak maps in both directions.
Common journey mapping mistakes
The failure patterns I see most often:
Mapping the wishful journey. Map describes what you wish customers did. Customer behavior in analytics doesn't match. Diagnostic: walk through the map and check each step against quantitative behavior data. Mismatches are real customer behavior; the map is fiction.
No emotional layer. Map captures actions but not feelings. Friction that's emotional (anxiety during checkout, frustration during onboarding) gets missed. Diagnostic: if the map has no sentiment line, add one.
Overly broad scope. Map covers all personas, all journeys, all stages. Result: nobody can use it. Diagnostic: if the map can't be summarized as "Persona X doing Journey Y for Outcome Z," scope is too broad.
Workshop-and-forget. Map gets created, presented, hung on the wall, never referenced again. Diagnostic: ask the team when they last consulted the map. If the answer is "the workshop where we made it," the map died on day one.
No cross-functional ownership. Map gets built by the CX team alone. Other teams (product, marketing, ops) don't engage because they didn't help build it. Diagnostic: if the map's solutions require teams who weren't in the workshop, they won't ship.
Single source of truth conflict. Map says one thing; product roadmap or marketing plan says another. The org has competing source-of-truth artifacts. Diagnostic: if multiple stakeholders give different answers about "what's the customer experiencing in stage X," there isn't one source of truth yet.
Tools and templates
Practical recommendations:
| Tool | Best for | Price, 17 Sep 2026 | Notes |
|---|---|---|---|
| Miro | Collaborative whiteboard mapping | $8 per member/mo | Most teams should start here; flexible, low-cost |
| Lucidchart | Diagramming + journey maps | plan-based, see vendor | Better for structured templates and exports |
| Figma | Designed journey maps for executive presentation | $16 per full seat/mo | Use only if visual polish matters; overkill otherwise |
| Smaply | Purpose-built journey mapping | plan-based, see vendor | More structure, more cost, only worth it if you map dozens of journeys |
| UXPressia | Purpose-built journey mapping | $36 per user/mo | Same trade-off as Smaply |
| HubSpot | Built into CRM | bundled in HubSpot plans | Convenient if you're already on HubSpot; weaker than purpose-built tools |
| Plain spreadsheet | Quick first-pass maps | Free | Underrated; great for initial validation before formalizing |
Entry-tier list prices, read from each vendor's own pricing page on 17 September 2026 and likely to move. The tool matters less than the discipline of updating the map and wiring it to action.
Real-world: what good journey mapping looks like
A few patterns from work with mid-market brands:
A DTC apparel brand mapped their post-purchase journey and discovered that the email cadence between purchase and delivery had a 4-day gap during which customers' anxiety spiked (visible in social mentions, support ticket spikes, and review-site sentiment). Adding a single shipping-update email at day 2 reduced "where's my order" tickets by 28% and lifted post-purchase NPS by 9 points.
A B2B SaaS company mapped onboarding for a specific persona (mid-market customer success leaders) and discovered that the third workflow they showed during onboarding was where most users dropped off — not because it was hard, but because by step three users were tired and the flow assumed they had energy for one more setup task. Reordering the onboarding to put the most engaging task third (rather than the hardest) lifted onboarding completion 22%.
A hospitality brand mapped the booking-to-check-in journey and discovered that the gap between booking confirmation and pre-arrival communication felt longer than it actually was — customers experienced 5 days of silence when the actual gap was 3 days, because nothing happened on days 2-3. Adding a "your stay is in 3 days, here's what to expect" email closed the perceived gap and lifted CSAT 7 points.
The common pattern: each insight came from cross-referencing the journey map against quant + qual data, finding the friction that emerged from both, and shipping a small specific operational change. None required redesigning the customer experience from scratch. All produced measurable retention improvements within a quarter.
How journey mapping fits into CX strategy
Journey mapping is one of five pillars in a complete CX strategy (along with customer understanding, measurement, delivery, and cross-functional accountability). For the full framing see our customer experience strategy pillar.
The map is the source of truth that lets the other pillars work:
- Customer understanding feeds the map (personas, behavioral data, qualitative texture)
- Measurement targets specific journey stages (NPS at touchpoint A, CSAT at touchpoint B)
- Delivery gets prioritized by friction severity from the map
- Cross-functional accountability gets distributed by which team owns which stage
Without the map, the other pillars work in isolation. With the map, they coordinate around the same source of truth.
AI and agentic journey mapping in 2026: what actually works, what to ignore
AI-powered journey mapping is the loudest claim in this field in 2026. The vendor pitch overpromises: AI maps your journey in real time, identifies friction dynamically, suggests interventions. The traditional method ignores AI entirely. The practitioner truth sits between those two positions, and applying the two-axis framework (judgment × volume) from the rethinkCX AI-in-CX pillar makes the line clean.
AI is genuinely useful for three high-volume, low-judgment tasks inside journey-mapping work:
- Unstructured-feedback synthesis at scale. Pulling themes from thousands of support transcripts, app-store reviews, and social mentions to identify recurring friction the structured data missed. This is where the volume-without-judgment combination wins.
- Touchpoint inventory from session-replay corpora. Auto-extracting touchpoint sequences from session recordings is faster and more complete than memory-based workshop inventories, and it surfaces touchpoints teams didn't realize existed.
- Sentiment-arc generation from support tickets. Building emotional-journey overlays from ticket descriptions and post-interaction surveys, scaled across thousands of customer paths, is something no workshop can match.
AI is genuinely useless for three high-judgment tasks that actually determine whether the map produces value:
- Cross-functional alignment on what to prioritize. Decisions about which friction is worth investing in depend on revenue context, organizational politics, and team capacity. AI has no purchase on any of those inputs.
- Ownership decisions. Assigning a touchpoint to a specific team is a structural choice with downstream accountability consequences. It requires negotiation, not classification.
- Operationalization follow-through. The 70% of the work that happens after the map is built. Quarterly reviews, named ownership, executive cover for redesigns: this is judgment work end to end.
The market signal supports the skepticism. Zendesk's 2025 CX Trends Report found 75% of CX leaders expecting 80% of customer interactions to be resolved without human intervention in the next few years. That number is real, but it describes customer-service resolution at runtime, not journey mapping at the strategic layer. Conflating the two is how teams end up spending budget on "AI journey mapping" platforms that automate the easy 30% of the work and leave the operationalization 70% untouched.
The point
Customer journey mapping is a high-leverage CX practice when the map is built for action and operationalized. It's a low-leverage activity when the map is built for presentation and forgotten. The seven-step methodology — scope, persona, touchpoints, emotion, friction, solutions, operationalize — works across industries and stages. The hard part is the operationalization, not the methodology.
Start with one persona, one journey, one outcome. Validate the map against quantitative behavior data and direct customer interviews. Wire the friction priorities into your CX measurement and operational cadence. Update the map quarterly. Treat it as a living artifact rather than a workshop deliverable.
For the digital side of this work, digital customer journey optimization picks up where the map itself stops. For the consulting side of building maps and operationalizing them inside your team, see our customer journey mapping service. And a journey map is only worth as much as the operation that has to act on it, which is the thing the CX maturity assessment scores.