
Voice of customer analytics is the practice of turning customer feedback into decisions someone is accountable for making. It covers three jobs: collecting signal across surveys, tickets, transcripts and reviews; analyzing it for themes, sentiment and root cause; and acting on what it says. The market is good at the first job, uneven on the second, and mostly absent on the third.
That last sentence is the whole argument of this article, so it is worth being blunt about it. Doing voice of the customer analytics end to end is genuinely hard, and a lot of companies stop short at collecting data and call it a day. Correct VoC ties customer data to business data and produces insight about the product and the experience. Not many organizations reach that stage, because the underlying data is not connected and the program ends up in complete isolation. What you get instead is surface-level feedback, handled customer by customer, which feels like progress and changes nothing structural.
The category has money behind it. Grand View Research sizes the customer analytics market at $14.57 billion in 2023, reaching an estimated $17.0 billion this year and a projected $48.63 billion by 2030, a 19.2% compound rate. Read that number carefully, though, because it measures the whole customer analytics market and VoC is one solution segment inside it. The figure gets quoted as if it were the VoC market, and it is not. What follows is what the analysis actually involves, the two conditions that decide whether it produces anything, how to run it, who has to own the outcome, what it costs, and why so many of these programs quietly die.
What voice of customer analytics actually is
The most useful definition is the least popular one, because it puts the burden on you rather than on a platform. Voice of customer analytics is the layer that converts feedback into organization-level decisions. Not summaries. Decisions, with an owner attached.
It sits one level above a VoC program. Running a voice of the customer program is about designing capture, cadence, routing and closure across channels. VoC analytics is the narrower question of what you do with the resulting pile of scores and sentences. You can have a well-run program that captures beautifully and analyzes nothing, and plenty of organizations do.
Three jobs make up the discipline, and it is worth holding them apart because the market treats them very differently:
Collection. Getting signal in from surveys, support tickets, call transcripts, chat logs, reviews, app stores, churn interviews. Well served. Most platforms do this competently.
Analysis. Turning that into themes, sentiment, root cause, and a connection to what the business is doing. Patchy. Many tools give you theme counts and stop well short of the kind of interrogation a proper BI layer would let you run.
Action. Assigning the finding to a team, tracking whether they did anything, and measuring whether it moved. Barely served at all.
Hold that split in mind for the rest of this article, because it explains almost everything about the shape of the category, including why so much writing on the topic stops at step two.
The four kinds of feedback data, and what each one hides
The taxonomy here is standard, and it usually stops one step short of being useful. Feedback splits on two axes at once: structured versus unstructured, and solicited versus unsolicited. Four quadrants. The part worth knowing is not what each one contains, it is what each one systematically fails to show you.
| Type | What it is | What it structurally misses |
|---|---|---|
| Structured, solicited | NPS, CSAT, CES, rating scales | Cause. A number tells you direction, never reason |
| Unstructured, solicited | Open-ended survey comments | Anyone who did not answer the survey |
| Unstructured, unsolicited | Reviews, social posts, inbound complaints | The unmotivated majority; writers have an agenda |
| Structured, unsolicited | Behavioral signals, usage, contact rates | Intent. You see what happened, not why |
The sampling problem underneath this table is the one nobody raises. Solicited feedback over-represents the two tails, the delighted and the furious, because those are the people with a reason to spend four minutes on you. The quietly dissatisfied customer, the one who is mildly annoyed and will not renew, rarely fills anything in. Support tickets have the same shape from a different angle: a ticket only exists if the customer cleared the effort bar of contacting you, so your ticket data is a census of problems bad enough to complain about and blind to everything below that line.
Call transcripts are the least biased source most organizations own and the least analyzed, because they are the most expensive to process. That gap is closing fast, and it is the first place I would look for signal nobody in your organization has read.
The instrument shapes the answer too, not just the sample. Research from Rival Technologies and Reach3, reported by CMSWire, found open-ended answers ran 2.5 times longer in a conversational survey format and nearly 8 times longer when people replied by video. Same customers, same underlying opinion, radically different volume of usable text. As Paula Catoira of Rival put it, "When customers stop talking, companies start guessing." Which means "we have feedback data" tells you very little on its own. How you asked determines what you got.
None of this is an argument for collecting from more sources. Most programs are already drowning. It is an argument for knowing what your particular mix cannot see, and for reading customer feedback analytics with that blind spot in mind. It also connects directly to success, effort, and emotion as the three things a customer experience is actually made of: different instruments detect different dimensions, and a survey stack tuned only to effort will never surface an emotional failure.
The two gates that decide whether any of this works
Here is where I part company with the conventional framing. The analysis is not the hard part in 2026. The models are good, the tooling is mature, and the theme detection is largely solved. Two conditions upstream of the analysis decide whether it produces anything, and both are set before a single chart is drawn.
Gate one: your feedback data has to connect to your business data
The failure is boring and near-universal. Feedback lives in a survey tool, revenue lives in the finance system, tickets live in the help desk, and nothing joins. So the program can tell you satisfaction dropped and cannot tell you for whom, on which product, at what point in their tenure, or whether those people subsequently left.
Concretely, VoC data analysis needs four things to be true:
- Feedback carries a customer identifier that joins to the account record. Without this you have opinion, not analytics.
- Free text survives. Ticket notes collapsed into macro templates and dropdown dispositions destroy the only unstructured signal your support org generates. If your agents pick from a list of twelve reasons, twelve reasons is all you will ever discover.
- Transcripts are retained, with the consent and recording position sorted out in advance rather than discovered during the project.
- Outcomes are joinable. You can connect a piece of feedback to whether that customer renewed, churned, upgraded, or complained again. This is the same joinability problem that decides whether churn prediction models work, and it fails for the same reason.
Run that list honestly. Most organizations fail at least one, and the ones that fail number four have a reporting function rather than an analytics function. Joinability is one of the dimensions the CX maturity assessment scores, and it is the one that comes back weak most often.
Gate two: your question set is a budget, and most people overspend it
This gate is the one nobody writes about, and it is arguably the more interesting of the two, because it is a design decision rather than an engineering one.
You only get so many questions. Response rate degrades with every additional one, so past a certain length you are trading coverage for completion, and a survey nobody finishes generates no data at all. That constraint makes question selection a strategic act. How much of your business you can see is determined at design time, not at analysis time. The CX team's real leverage is being smart enough about what to ask that a short survey still supports deep extraction later.
Which brings me to a rule I repeat constantly and have watched play out at multiple organizations: if the score on a question is always 100%, you are asking the wrong question. You are no longer getting insight. You are patting yourself on the back about being perfect and satisfied. A question that cannot produce a bad answer is a wasted slot in a budget you did not have room in to begin with.
That happens more than people admit, and usually for understandable political reasons. Questions that reliably score well are comfortable to present. They survive review cycles. They make the quarterly deck easy. And they quietly consume the two or three slots that could have told you something you did not already know.
How the analysis actually works, and whether you need AI for it
The mechanics are less mysterious than the category makes them sound. Four things happen to a body of unstructured feedback: sentiment scoring assigns polarity, theme or topic detection groups comments into recurring subjects, entity extraction pulls out the products, locations and people being discussed, and root cause attribution tries to connect a theme to something the business did. The first three are largely commodity. The fourth is where tools diverge, and where most of them are weaker than the marketing suggests.
On the AI question, the honest answer is more interesting than "yes, use AI." A peer-reviewed 2025 study in Artificial Intelligence Review, Do you actually need an LLM?, compared small language models against large ones on exactly this kind of work. Large models won on sentiment classification, but at over ten times the parameter count and twenty to forty times the runtime. Fine-tuned small models beat them on domain-specific correlation analysis while running more than ten times faster. The finding is task-dependence, not superiority, which matters commercially: if your vendor is charging you for frontier-model inference on a job a fine-tuned small model does better and cheaper, you are subsidizing an architecture choice, not buying accuracy.
The software landscape sorts into four categories, and knowing which one you are buying prevents most procurement mistakes. Survey-first experience suites are built around distribution and scoring at scale. Text analytics engines specialize in themes and sentiment across large unstructured corpora. Support-ticket-native voice of customer analytics tools work on the feedback already sitting in your help desk. Digital experience platforms capture behavioral signal alongside comments. Each is excellent at its origin story and thin outside it, and most organizations end up owning two.
The category is also consolidating rather than innovating. Gartner's 2026 Magic Quadrant for Voice of the Customer Platforms, summarized by CX Today, evaluated twelve vendors and named four Leaders: Qualtrics, Medallia, Sprinklr and Press Ganey Forsta. The detail worth noticing is not the Leader list. It is that the quadrant contains no Visionaries at all. A mature market where nobody is placed for novel vision is a market where the remaining differentiation is packaging, and where the interesting problems have moved elsewhere. If you want the deeper mechanics of how models generate insight from this kind of data, machine learning for customer insights covers the modeling side properly.
How to run a voice of customer analysis, in the order that works
Most published processes are the same six or seven steps in a different order, and they are broadly right. What they get wrong is starting with data collection. Start with the decision you want to be able to make, then work backwards to the question that would inform it.
1. Name the business question first. Not "how satisfied are our customers" but "which stage of onboarding is costing us second-year renewals." A vague question produces a dashboard. A specific one produces an owner.
2. Audit what you already have before collecting anything new. Most organizations have more unanalyzed feedback than they think, sitting in tickets and transcripts. New collection is the expensive option and usually the second-best one.
3. Design the question set as the budget it is. Apply gate two above. Kill anything that always scores well.
4. Fix the joins. Identifier, free text, retention, outcomes. This is unglamorous and it is the whole project.
5. Analyze for theme and cause, not just sentiment. Sentiment tells you the temperature. Themes tell you the subject. Only the link between a theme and a business event tells you what to change.
6. Route each finding to a named owner with a date. A finding without an owner is trivia.
7. Measure whether the change moved the metric. Then close the loop back to the customers who raised it.
Which metrics, and what they leave out
Pick one headline metric and mean it. The temptation to run NPS, CSAT and CES simultaneously produces three numbers that move independently and an organization that argues about which is real. I have written a fuller argument on picking a single survey metric, but the short version is that your VoC metrics should match the decision you named in step one. Relationship questions take a relationship metric; transactional moments take a transactional one.
Where do you measure a journey that has no end?
This is the question I have never seen a VoC guide ask, and it decides your whole measurement design.
In retail it is easy, which is why retail examples dominate the literature. There is a natural terminus. The customer found you, bought, received the item, possibly returned it, possibly called support. Ask the relationship question after the return window closes and you have measured a genuine end-to-end journey.
Insurance has no terminus. Someone buys a policy and may never file a claim. They might be a customer for thirty years and never once use the thing they are paying for. Where exactly do you put the survey?
The answer we landed on has two parts, and they do different jobs. First, transactional surveys anchor to the touchpoints that do exist: policy issuance, and a claim if one is ever filed. Second, where there is no natural end, the contract cycle substitutes for one. Insurance renews annually, so renewal becomes the moment to ask how the year went, because it is the only recurring decision the customer actually makes. On top of that we run a relationship survey deliberately decoupled from any event, roughly six months offset from renewal or issuance, that simply asks how things are going.
That third instrument is the one that earns its place. It is the only way to hear from the policyholder who has transacted with you zero times all year, and that customer is invisible to every event-triggered survey you own. If you run a subscription, a utility, a bank, or anything else where the relationship outlives the transactions, the same logic applies: your touchpoint surveys are structurally incapable of seeing your quietest customers.
Who owns it, and why that is the wrong question
Ownership is nearly always treated as an assignment problem. Put VoC in CX, or Insights, or Product, define your action owners, done. I think that framing is wrong, and I say that as someone who has run these programs from inside CX.
Voice of customer work can be run by CX, and usually is. It does not really matter who runs it. What matters is organization-wide customer centricity, and that has to start at the top and travel down. The programs that fail are the ones where CX is pushing importance upward.
That is the actual variable. Not the reporting line, the direction of the pressure.
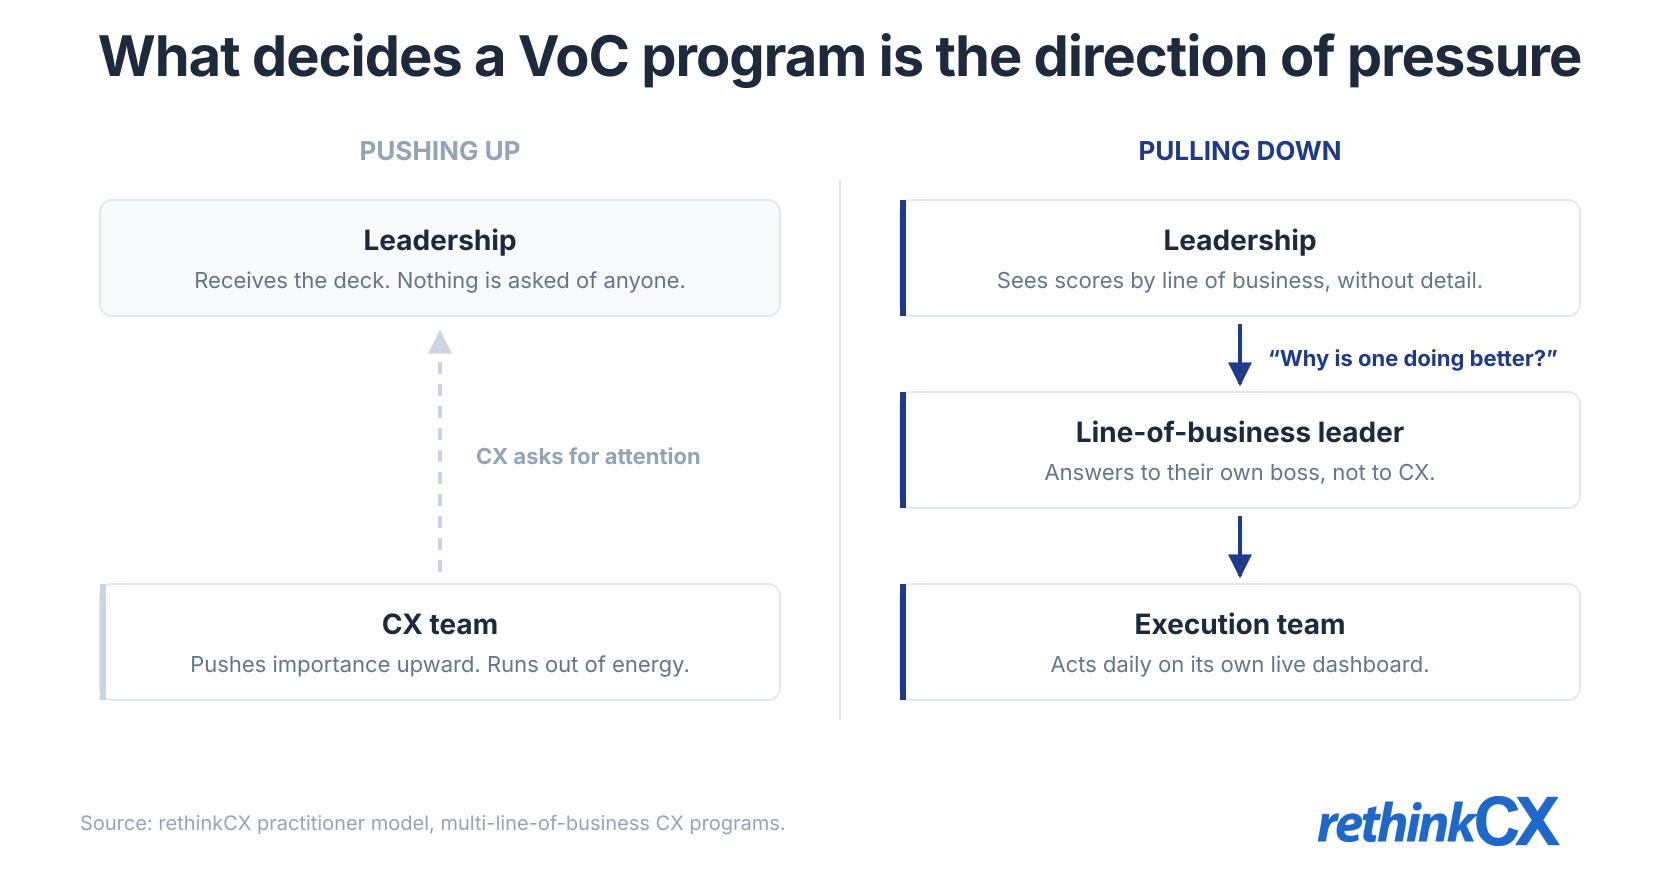
The mechanism I use now, as Head of CX, runs at two altitudes at once.
At the top, I hold monthly meetings with the leadership team, and I present overall metrics line of business by line of business. Deliberately without detail. The absence of detail is the design, because a table of line-of-business scores with no explanation attached provokes exactly one question from a board: why is one doing better than the other? Once leaders are comfortable asking it, that question travels down through their own reporting chains. A team lead now has their own boss asking why their line is underperforming, rather than a CX team asking for attention. If they do not have an answer, that is on them, and they go and find one. The pressure creates demand for the data instead of CX pushing supply at people who did not ask.
Running in parallel, I work directly with the teams responsible for execution in each line of business and give them the full run-down of data and insight so they can build real action plans. Both altitudes matter. The top one creates the accountability; the bottom one makes it actionable. Turning those plans into a standing operating cadence, with owners and a review rhythm, is call center strategy work rather than analytics work, and the two get conflated constantly.
The corollary is about access, and it is where a lot of CX teams get in their own way. Teams should never have to wait for CX to hand them data. Our job is to analyze and present the synthesis in monthly and quarterly forums. Their job is to watch their own dashboards in real time and adjust daily. Any program where insight is only available through the CX team has made itself a bottleneck and called it governance.
Gartner has published on this general shape of problem in Why Voice of the Customer Falls Short, and How a Two-Loop Process Helps, and the two-loop framing (resolve the individual case, and separately change the thing that caused it) is a good vocabulary for the split. My addition is that the second loop is not a process problem. It is a pressure problem.
One honest caveat, because I will not pretend this is a project plan with a timeline. Some leadership teams are forward-thinking and get it quickly. Others require years of drilling. It depends entirely on the leadership, and customer centricity is one of those things that not everyone genuinely gets, even though most leaders will tell you it is critically important. Where this sits in the wider question of where CX programs report and who owns them is a longer conversation, but the pressure-direction test is the one I would apply first.
What it costs, and how to prove it paid
There is no list price for any of this, which is why no one writes this section. Let me give you the shape instead of a number.
At the top of the market, Medallia will not seriously engage below roughly a million dollars a year. At the other end, you can run a credible program on something like SurveyMonkey for around twenty thousand. Neither of those is the right or wrong decision, and I want to be clear about that, because the spread invites snobbery. They fit different volumes and different expectations. A six-line-of-business insurer and a single-brand retailer have genuinely different problems.
In the middle, there is real transaction data. Vendr publishes anonymized contract values from its procurement dataset, and its Qualtrics figures show a median around $30,000 a year across 318 purchases, with individual contracts running from $6,910 to $139,920.
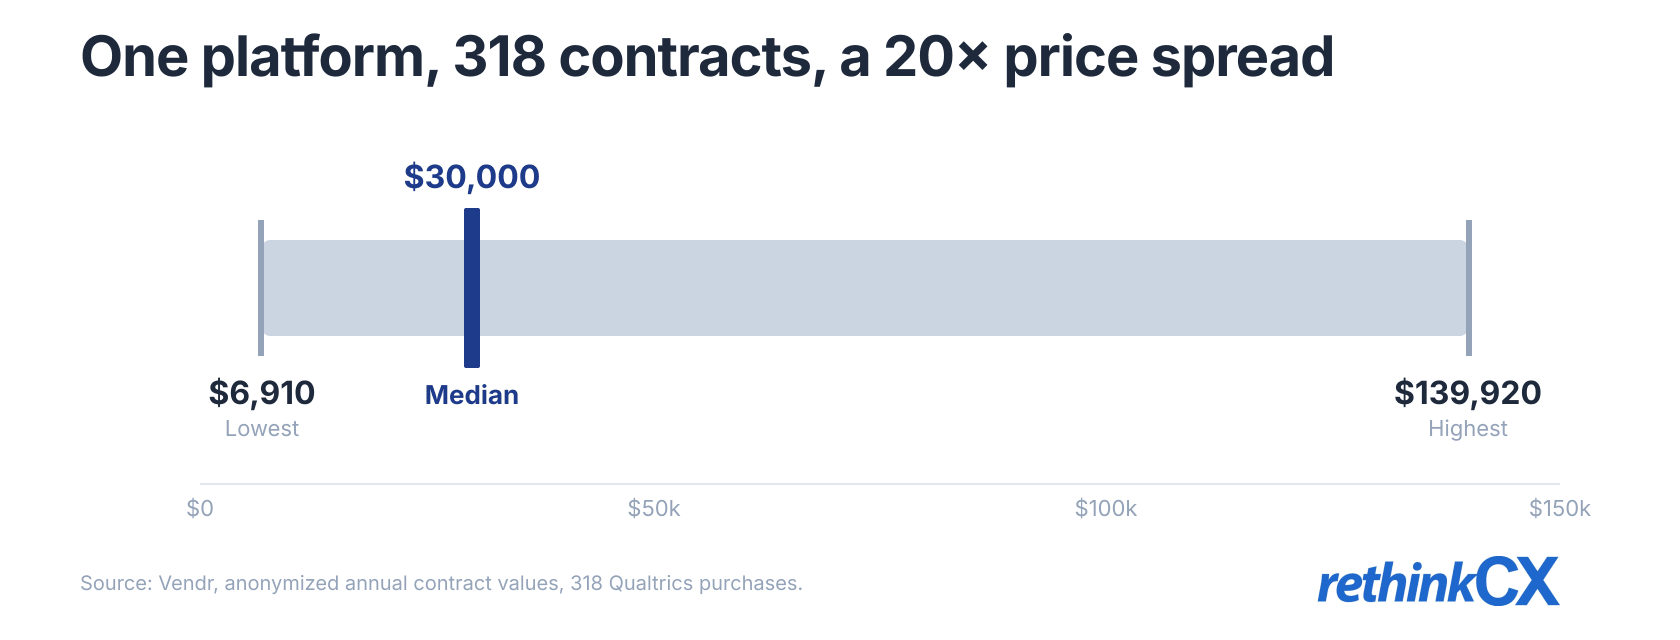
A twentyfold spread on the same product tells you something important: the price is a function of scope and negotiation, not of a price list. Treat any number you are quoted as an opening position. And note what that figure does not include. It is platform contract value for one vendor, not total program cost.
The two line items nobody publishes sit on top of it.
Implementation. Integration work, taxonomy design, dashboard build, and the internal politics of getting other systems to hand over their data. In the engagements I have seen, this is routinely underestimated because it is scoped as a technical task when most of it is organizational.
Headcount, which is where the real variable hides. My view is that a VoC analytics team can run at around two to four people. But that number depends almost entirely on your software. If the platform genuinely automates the analysis, the team's job is to interpret and present, and a small team scales fine. If you are exporting to spreadsheets and coding themes by hand, it becomes a data science project, and data science projects are only sustainable with more headcount. The software decision and the headcount decision are the same decision, made once, and most organizations make them separately.
The bigger cost trap is structural. Current systems cover one side of the journey well. They collect data and send surveys, and they do that competently. What they generally lack is the interrogation depth you would get from something like Power BI, and they lack action tracking almost entirely. So buying a real VoC system is only part of the equation. You then either acquire more systems to cover the other pieces or hire people to do that work manually, and that second bill arrives about six months after the first one.
On proving it paid, resist the urge to build an ROI model before you have a single closed loop. The first credible number is almost always a specific fix traced to a specific finding: a policy changed, a page rewritten, a carrier renegotiated, and the contact volume or churn rate that moved afterwards. One of those is worth more internally than a spreadsheet extrapolating the value of satisfaction. If you want help structuring the program before you commit budget, that is the sort of thing our voice of customer advisory work exists for.
Why these programs die
Not from bad analysis. I have rarely seen a VoC program fail because the themes were wrong.
They die in the gap between analysis and action. Recall the three jobs from the top of this article: collection, analysis, action. The market serves collection well and action barely at all, so most organizations assemble a program that is structurally incapable of the third job and then wonder why nothing changes. Tools that connect analysis to assignment and progress tracking exist. The comparison between a pure text-analytics engine and a platform that carries case management and closes the loop is a useful illustration of where the category line falls. But most stacks simply do not have that layer, and the finding goes into a slide instead of a queue.
The second killer is the one covered above: pressure pointing the wrong way. A program pushing insight upward at leaders who did not ask for it will run out of political energy inside a year.
The third is subtler. Programs get reduced to their headline number. NPS becomes the thing that is reported, the score becomes the goal, and the analysis underneath it stops being read. At that point the program is a metric, not an analytics function, and the first budget review will treat it accordingly.
None of this is offset by the industry getting better on its own. Forrester's 2026 Customer Experience Index found North America finally moving, with 26% of brands posting statistically significant gains against 7% declining, but Asia Pacific went the other way, with 19% of brands falling. Forrester's Pete Jacques summarizes the global picture as "incremental change — not breakthrough progress," which is roughly what a decade of collecting feedback without building the action layer should be expected to produce.
Three things I'd do differently
Fix the joins before buying anything. I have watched organizations run a procurement cycle, sign a platform, and then discover their feedback cannot be tied to a customer record. The platform is not the constraint and the demo will never reveal that. Spend the first six weeks proving you can connect one survey response to one account to one renewal outcome. If you cannot, no purchase fixes it.
Treat the question set as a budget from day one. Every question you add costs you response rate, and every question that always scores well costs you a slot. I would audit the survey annually the way you would audit a spend line, and cut anything that has not produced a decision in a year.
Give teams live access immediately, not eventually. The instinct is to control the narrative, present polished findings, and roll out dashboards later once the data is clean. That sequencing trains the organization to wait for CX. Ship the dashboards early and imperfect, keep the monthly synthesis for the leadership altitude, and let the teams who own the work see their own numbers every day.
One last thing, and it is the test I would apply to any program including my own. Point at a change the business made in the last quarter because of something a customer said. If you can name it, the program works. If the honest answer is a set of reports that were circulated and read, you have built a very expensive listening habit, and the two gates above are a reasonable place to start working out why.